
How every message is made, and what it cannot see.
For agronomists, scientists, funders and anyone doing diligence: what we compute, from which sources, under which rules, how each crop model is reviewed, and the known limits of the signal.
Last updated .
Sources, methods and cadence.
- Sentinel-2 / HLS / S-1Satellite passA new image of the field about every 5 days.
- cloud maskClean pixelsCloud and shadow removed; small plots flagged.
- NDVI, NDRE, NDWIField indicesComputed inside the field boundary only.
- baselineCompared with historyAgainst the field's own past weeks, plus weather.
- stateOne of four statesWatch, Act, No clear view or Escalate.
- WhatsAppOne weekly messageUnder 300 characters, with date and source.
One real message, step by step
The message of 20 May 2026 for the 3.2-acre field near Katol, traced from the satellite pass to the text. All values are this field's own readings.
-
1
Satellite pass
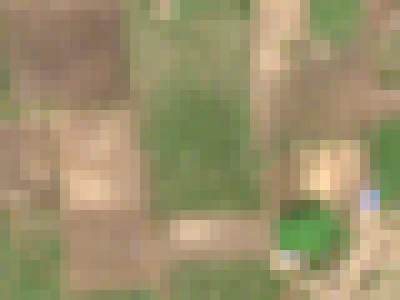 10 May 2026
Sentinel-2 photographs the field every few days. Clear passes on 10 and 20 May 2026.
-
2
Clean pixels, inside the field
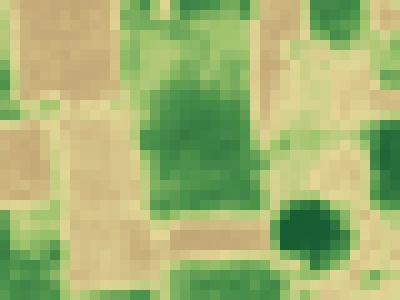 NDVI 0.61
129 squares of 10 m fall inside the boundary. Cloud and shadow are masked; the field's greenness is their average.
-
3
Compared with its own year and its neighbours
This field Fields within about 500 m (median) 10 to 20 May
0.61 to 0.38 in 10 days: down 38%. The fields around it fell 22%. A drop much faster than the neighbourhood is worth a visit.
-
4
One state, one message
Watch
20 May: your field's greenness fell 38% in 10 days (0.61 to 0.38), faster than the fields around it (22%). This week: check the soil moisture and the irrigation.Watch means something changed: check the field. It never carries a dose, a product or an irrigation volume.
Contains modified Copernicus Sentinel data, processed by VarshaKrishi. Field outline traced from the image; crop not confirmed on the ground.
| Quantity | Source | Method | Cadence |
|---|---|---|---|
| Vegetation and water indices per field (NDVI, NDRE, EVI, NDWI) | Sentinel-2 L2A surface reflectance (ESA Copernicus); NASA HLS to fill cloud gaps | Index formulas per the cited papers; per-field statistics over cloud-free pixels, with valid-pixel count and cloud fraction stored with every value | Every pass (about 5 days), summarised weekly |
| Radar growth and standing-water state | Sentinel-1 GRD | Backscatter trend per field, used when optical passes are blocked by monsoon cloud | Every pass, summarised weekly |
| Field baseline and change | The field's own history | Change against the field's own baseline once enough clean passes exist; until then the message says the baseline is building | Weekly |
| Weather and reference evapotranspiration | Weather provider forecast and observations | FAO-56 Penman-Monteith, with Hargreaves-Samani where only temperature is available | Daily |
| Irrigation timing (Decide only) | Satellite, weather, crop coefficients, optional reference-kit soil moisture | FAO-56 root-zone water balance with crop-specific coefficients | Weekly, with a decision window |
| Disease-risk window (Decide only, tomato) | Hourly weather; leaf wetness where a kit exists | TOM-CAST disease severity values | Daily accumulation, weekly message |
Every derived value is appended to a per-field, tamper-evident record chain together with the identifiers of its raw inputs, so it can be recomputed (see replay).
From reflectance to a message
Sentinel-2 records how much red and near-infrared light each 10 m square reflects. Healthy leaves absorb red and reflect near-infrared, so NDVI, (NIR minus red) divided by (NIR plus red), rises with green, dense canopy. We compute it over the cloud-free squares inside each field and compare it with that field's own history.
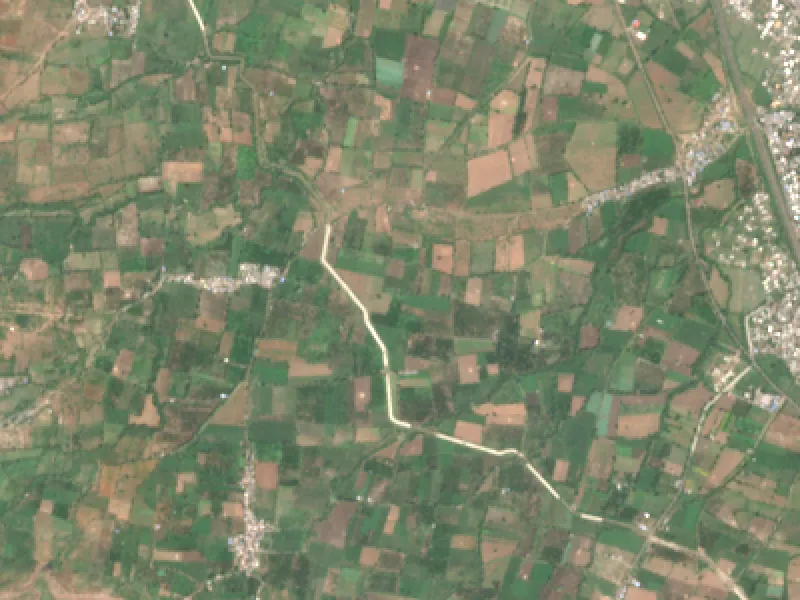
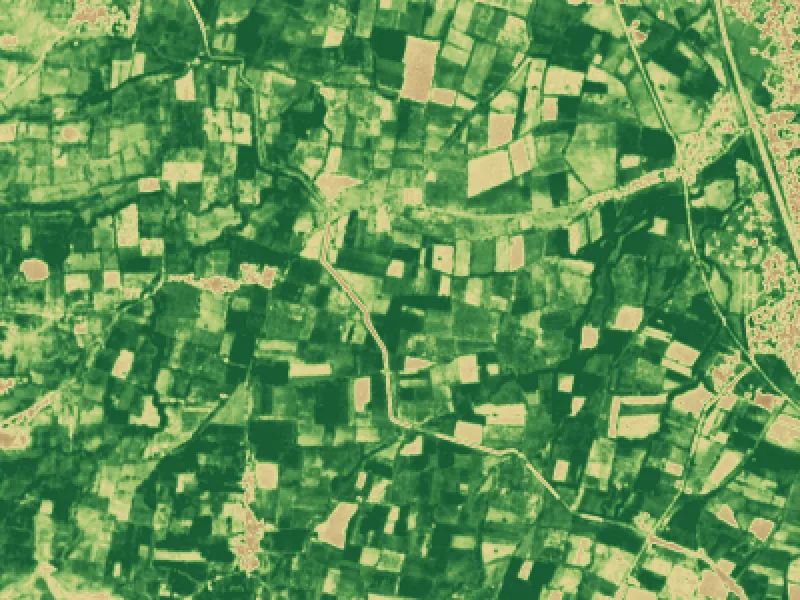 4 km x 3 km · 10 m pixels
Every message is one of four states.
| State | Meaning | Who can receive it | Example reason |
|---|---|---|---|
| Act | A decision is due within a window (irrigate within 2 days; inspect the north block) | Decide fields, for crops with a reviewed model | Root-zone water below the safe level; no rain forecast for 5 days |
| Watch | Something changed; check the field. No prescription | Watch and Decide | Greenness fell 12% since last week while rain stayed low |
| No clear view | The satellite could not see the plot well enough this week | Watch and Decide | Cloud on 6 of the last 7 passes; radar shows no standing water |
| Escalate | Beyond the model; a person should look | Decide fields | Two weeks of decline across the whole plot; agronomist asked to review |
Plan rules
A field without a reviewed crop model, or on the Watch plan, never receives Act or Escalate. Watch messages contain no dose, no product name, no pesticide and no irrigation volume.
A message every week
Every active field gets one message a week, even when the satellite could not see it. Silence never means "healthy".
Plot size
Below 0.5 ha the signal is approximate, so we report direction only and show how many clean pixels we used. Below 0.2 ha a field is on Watch only.
Monsoon
A field without a clean optical pass for 15 days gets a radar-based message (standing water, waterlogging and growth trend), never an optical stress call.
Decide opens crop by crop, after review.
A crop moves to Decide only when an agronomist has reviewed and signed its model. The review document is then linked here.
| Crop | Region | Plan | Status |
|---|---|---|---|
| citrus (Nagpur orange) | Vidarbha, Maharashtra | Decide, 2026-27 season | Model built on FAO-56 and technically reviewed; awaiting agronomist sign-off |
| Rice, Wheat, Cotton, Sugarcane, Soybean, Maize, Pulses, Vegetables | All of India | Watch | Crop calendars for stage estimates; no prescriptions |
| Any other crop | All of India | Watch | Trend and weather |
What 10 m pixels and monsoon cloud look like.
Two real examples from Katol, in the Nagpur orange belt, that explain the first two entries of the register below.
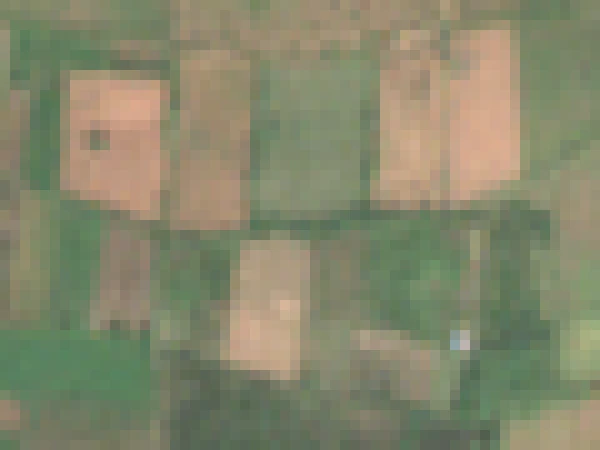 True colour
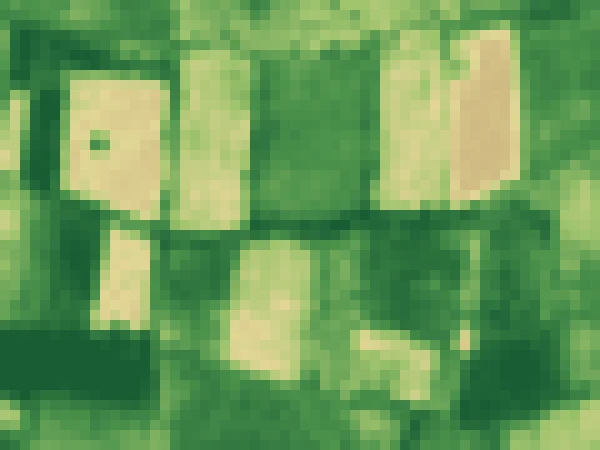 NDVI greenness
L2, monsoon cloud. From late June to early September 2026 almost every Sentinel-2 pass over Katol was too cloudy to use. In those weeks the message says so and relies on Sentinel-1 radar.
Every pass over this field for a year, free to download (open data)
What the signal cannot do.
Numbered so a paper or a partner can cite an entry. Entries are added, never removed.
- L1. Small plots are approximate.Below 0.5 ha few clean 10 m pixels fall inside the boundary; we report direction only and show the valid-pixel count. Below 0.2 ha a field is on Watch only.
- L2. Cloud hides fields in the monsoon.Optical indices are impossible for weeks at a time. Sentinel-1 radar shows standing water, waterlogging and a coarse growth trend only, and the message says so.
- L3. Confidence values are expert priors until calibrated.A confidence value describes how well the signals agree, not a probability of truth. Calibration needs field measurements, which the reference plots provide.
- L4. Crop stage on Watch is calendar-based.Stage is inferred from the sowing date and a crop calendar, not observed.
- L5. Satellites do not see pests or disease directly.Optical indices show stress, not its cause. Disease-risk windows come from weather models, and the message asks the farmer to inspect rather than naming a disease.
- L6. Translations.Marathi, Hindi and English copy is written with AI assistance and checked against published agricultural guidance; review by native speakers and an agronomist is still pending. Bengali, Gujarati, Punjabi, Tamil and Telugu are machine translations, labelled as such in the product.
- L7. Reference-kit readings depend on installation.Soil-moisture probes read a small volume of soil; depth, contact and calibration dominate accuracy, so kit metadata ships with every export.
- L8. Weather is a third-party model.Evapotranspiration uses forecast and gridded observations, not an on-site station unless a reference kit includes one.
The standards behind every number.
- FAO-56, crop evapotranspiration.Allen, R.G., Pereira, L.S., Raes, D., Smith, M. (1998). FAO Irrigation and Drainage Paper 56. FAO. Reference evapotranspiration, crop coefficients and the root-zone water balance.
- TOM-CAST and FAST, disease severity values.Madden, L., Pennypacker, S.P., MacNab, A.A. (1978), Phytopathology 68; Pitblado, R.E. (1992), Ridgetown College. Tomato disease-risk windows from temperature and leaf wetness.
- Sentinel-2 MSI Level-2A.European Space Agency, Copernicus Data Space Ecosystem. dataspace.copernicus.eu.
- NASA HLS.Claverie, M. et al. (2018). Remote Sensing of Environment, 219, 145-161. doi:10.1016/j.rse.2018.09.015.
- Sentinel-1 GRD.European Space Agency, Copernicus. C-band radar backscatter.
- NDVI.Rouse, J.W. et al. (1974). NASA SP-351.
- NDRE.Gitelson, A., Merzlyak, M.N. (1994). Journal of Plant Physiology, 143(3), 286-292.
- EVI.Huete, A. et al. (2002). Remote Sensing of Environment, 83(1), 195-213. doi.
- NDWI (canopy water, NIR and SWIR).Gao, B.-C. (1996). Remote Sensing of Environment, 58(3), 257-266. doi.
- Citrus crop coefficients.FAO-56 Tables 12 and 17 for citrus by canopy cover, with the drip adjustment of FAO-56 Eq. 75; regional agronomist review to follow before Decide opens.
Results are published with their protocol.
The first season's outcome study will be published here, with its design and its data. We publish counts and measured outcomes only, never projections.
Design
Sponsored Decide fields compared with Watch-only fields in the same region, with measures registered before the season.
Measures
Reply rate, action rate, decision windows closed with a logged action, irrigation events and farmer-reported outcomes.
Review
Written up with the reviewing agronomist and the institution hosting the reference plots, with data available to them.
Publication
Published here first, with the limitations register updated alongside.
Check any record yourself.
- Request an exportfor a field or a group, through your dashboard or by email. Each derived record carries its raw-input identifiers, processing version and record id.
- Fetch the raw inputsfrom the public sources above (Sentinel-2, HLS and Sentinel-1 scenes by id; weather by provider and time).
- Recomputethe indices and the FAO-56 balance with the cited formulas, then the record hash over the ordered records.
- Compare.A matching hash shows the record was not altered after it was written. Report any mismatch to us and we investigate it openly.